The one-line takeaway
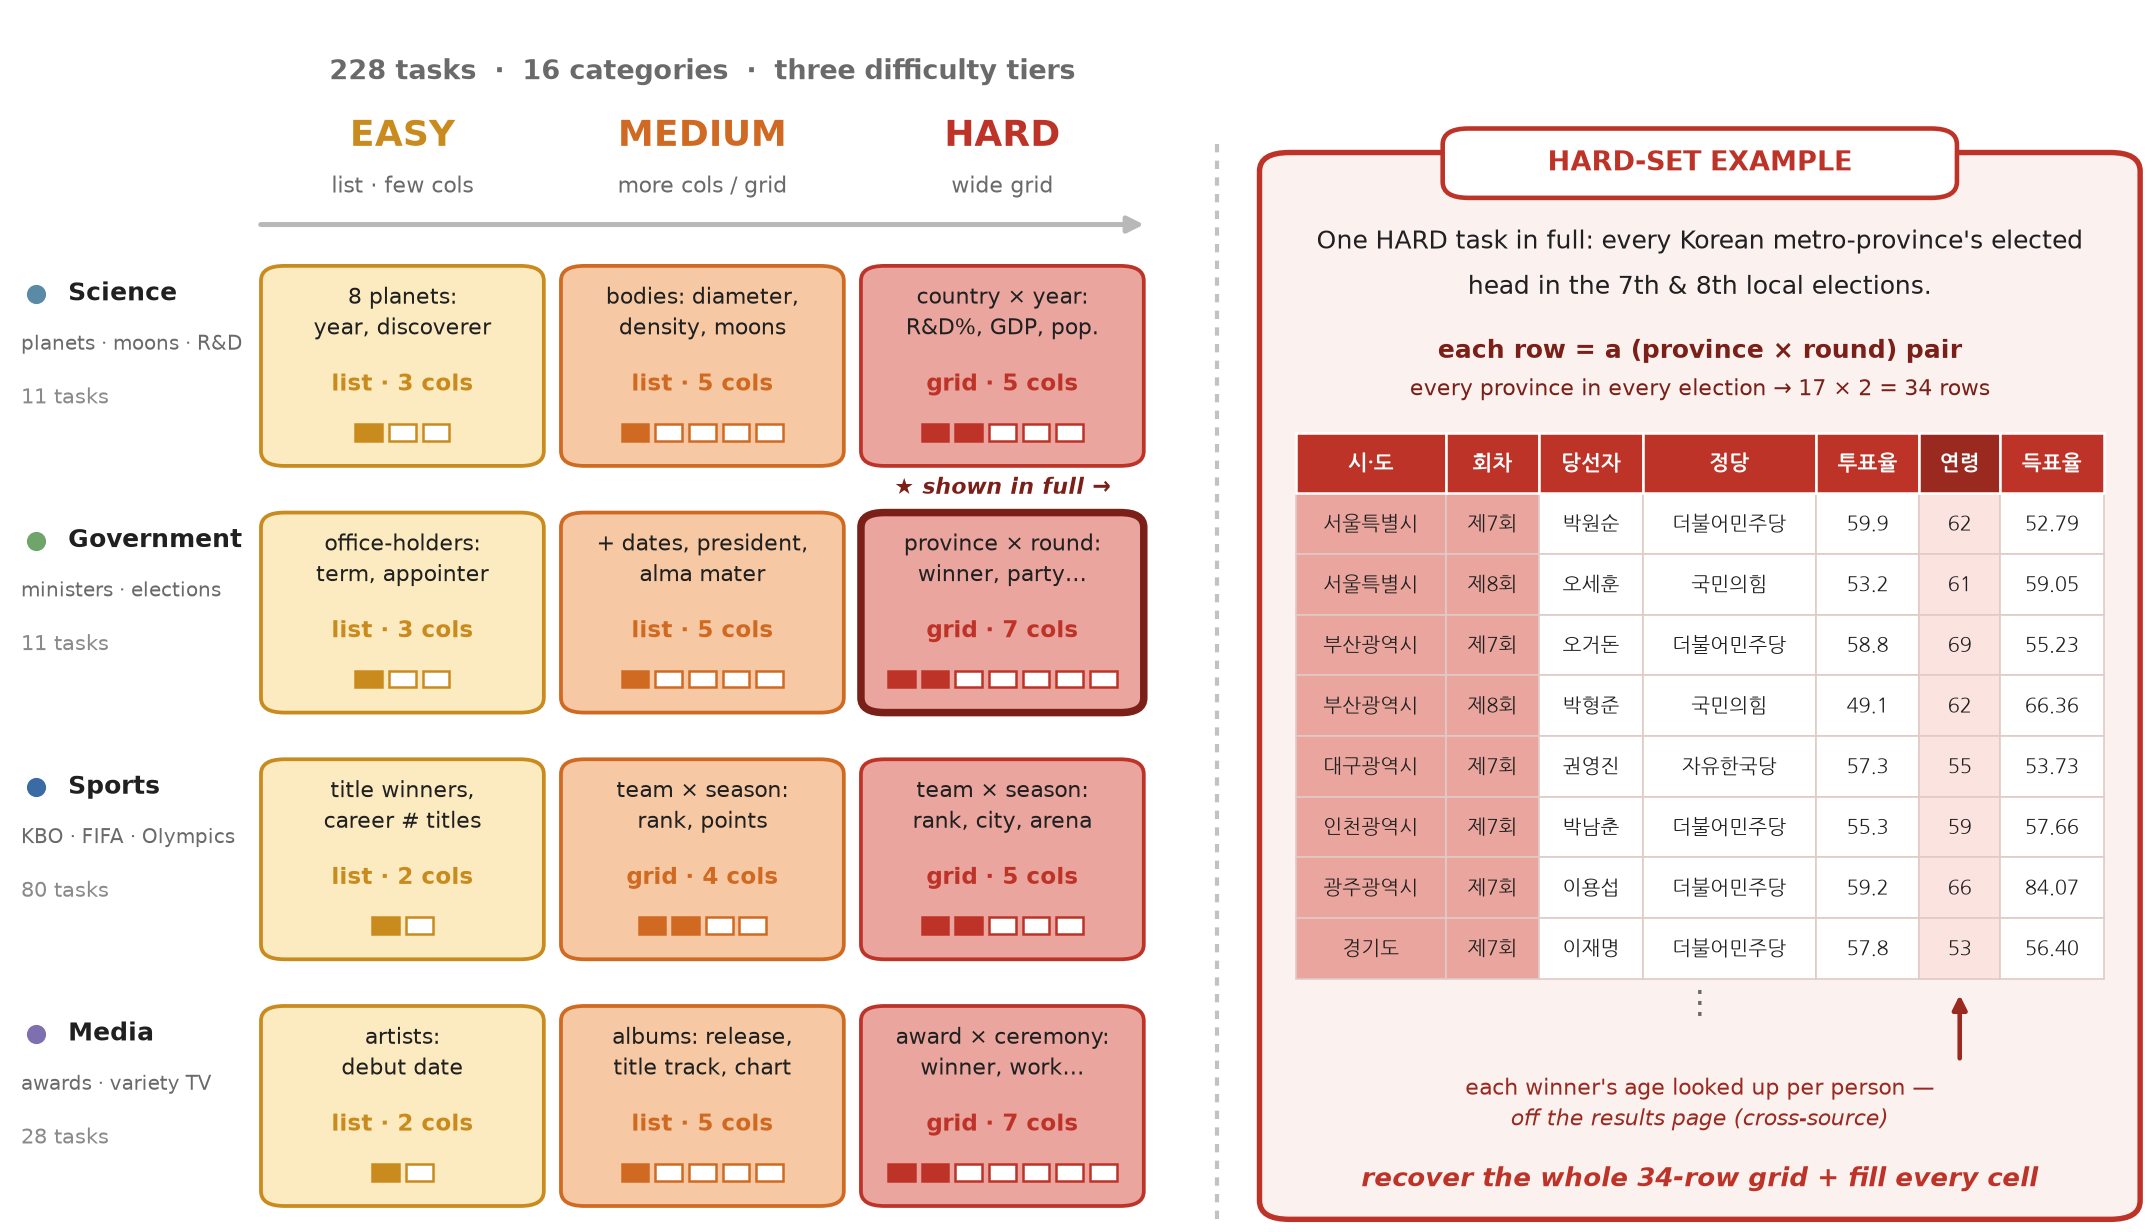
What the benchmark asks
Enumerate the whole set, then fill every cell
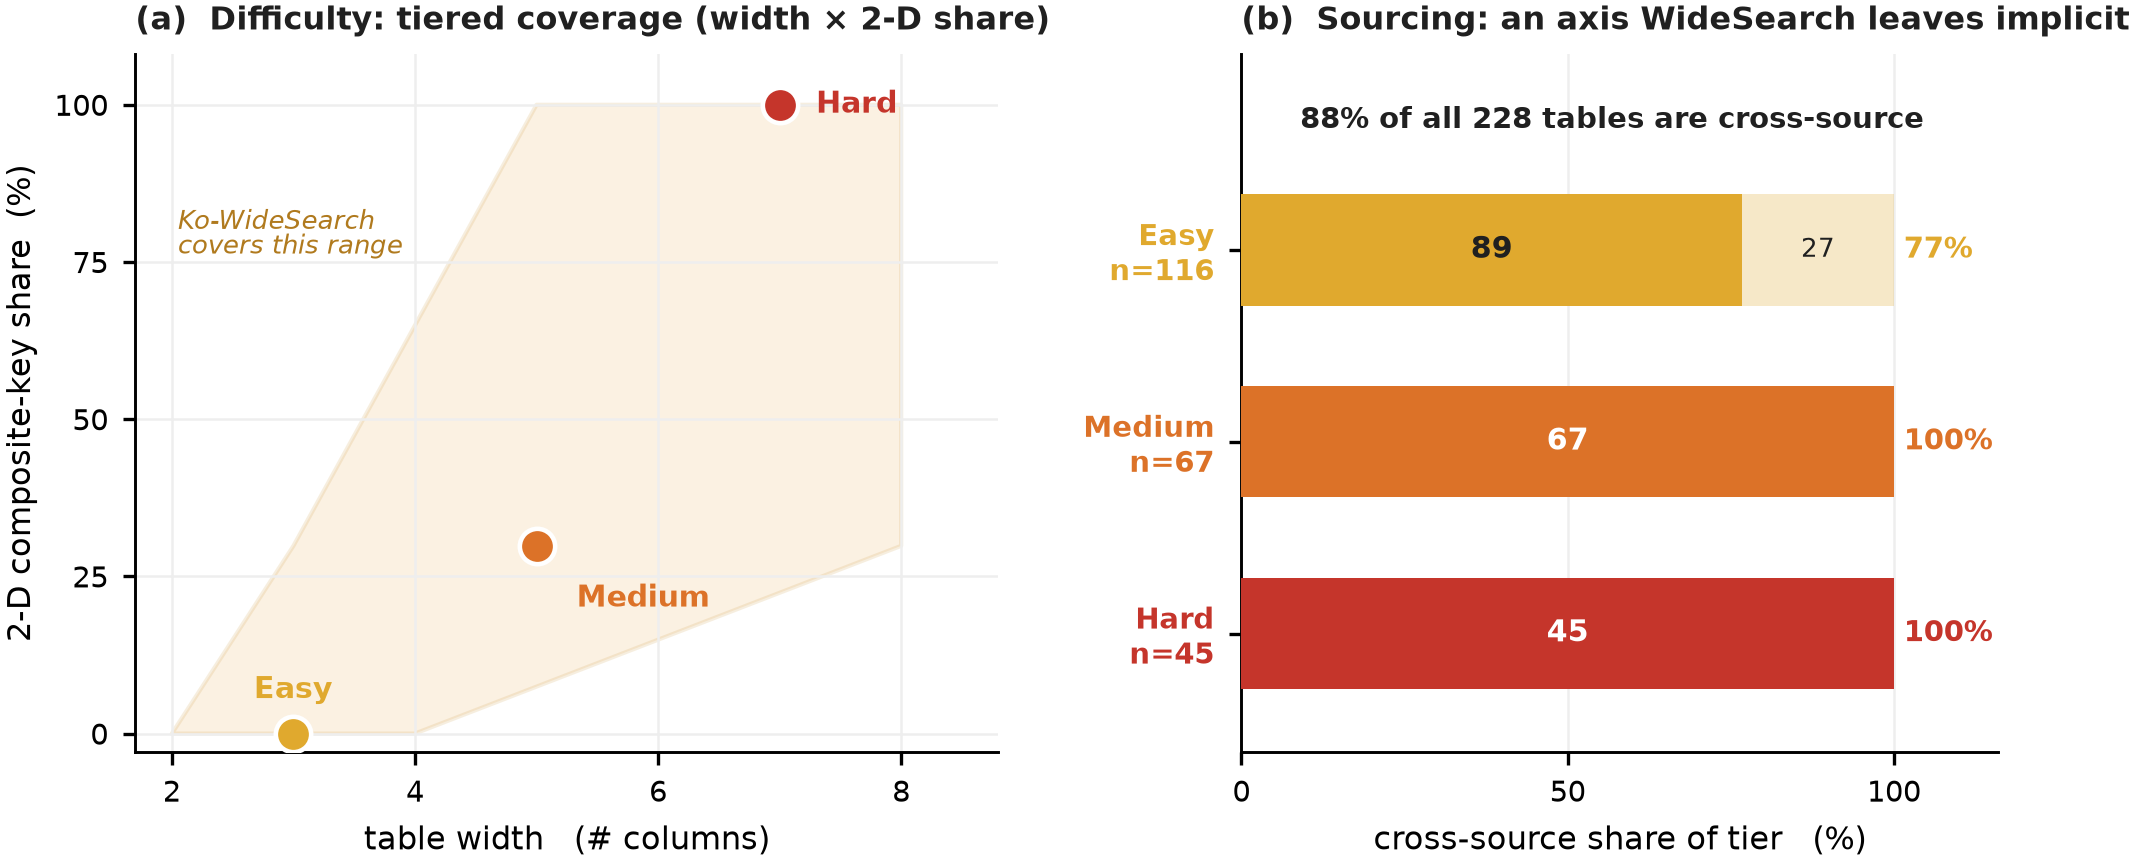
Each task names a set-parent entity — a TV season, a dynasty, a league, an administrative region, an election — and asks for its full membership plus a per-item attribute table. Difficulty is set by two structural knobs dialed independently: table width (number of attribute columns) and a 2-D composite key (membership becomes a cross-product, e.g. team × season). From Easy to Hard, cross-product membership climbs from 0% to 100%.
What we found
Six findings that hold across twenty agents
Sets, not rows
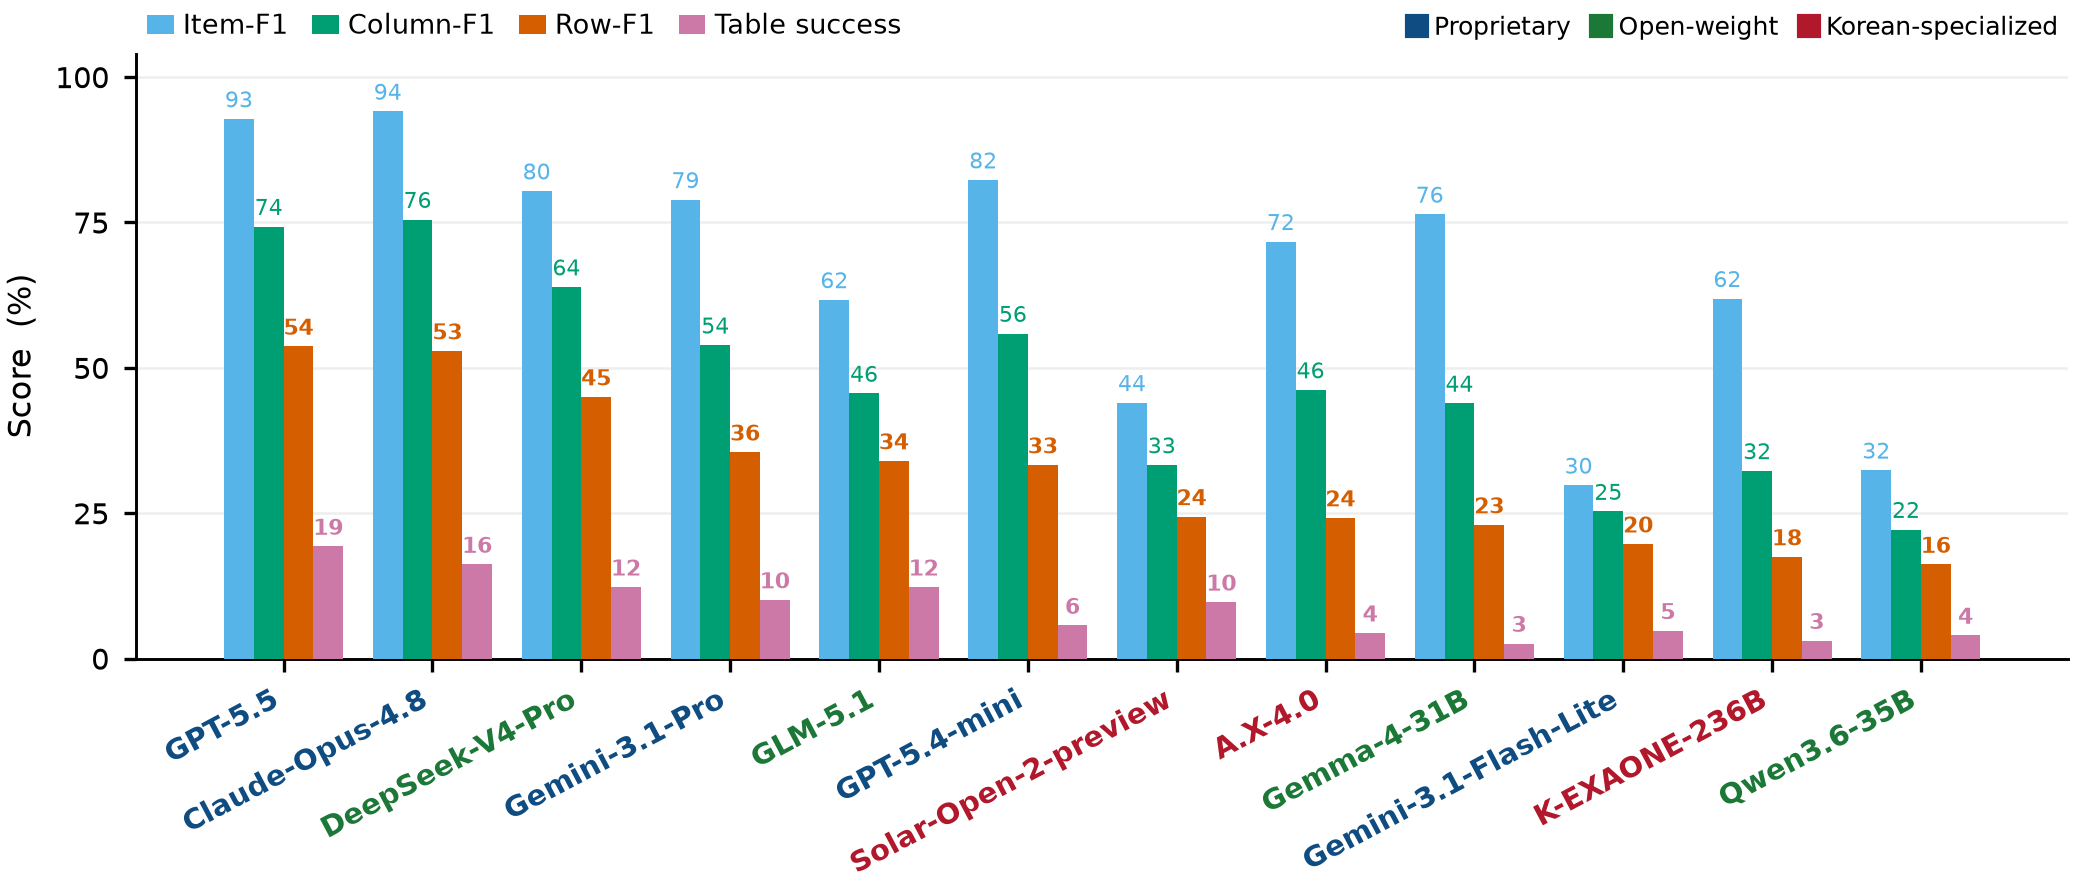
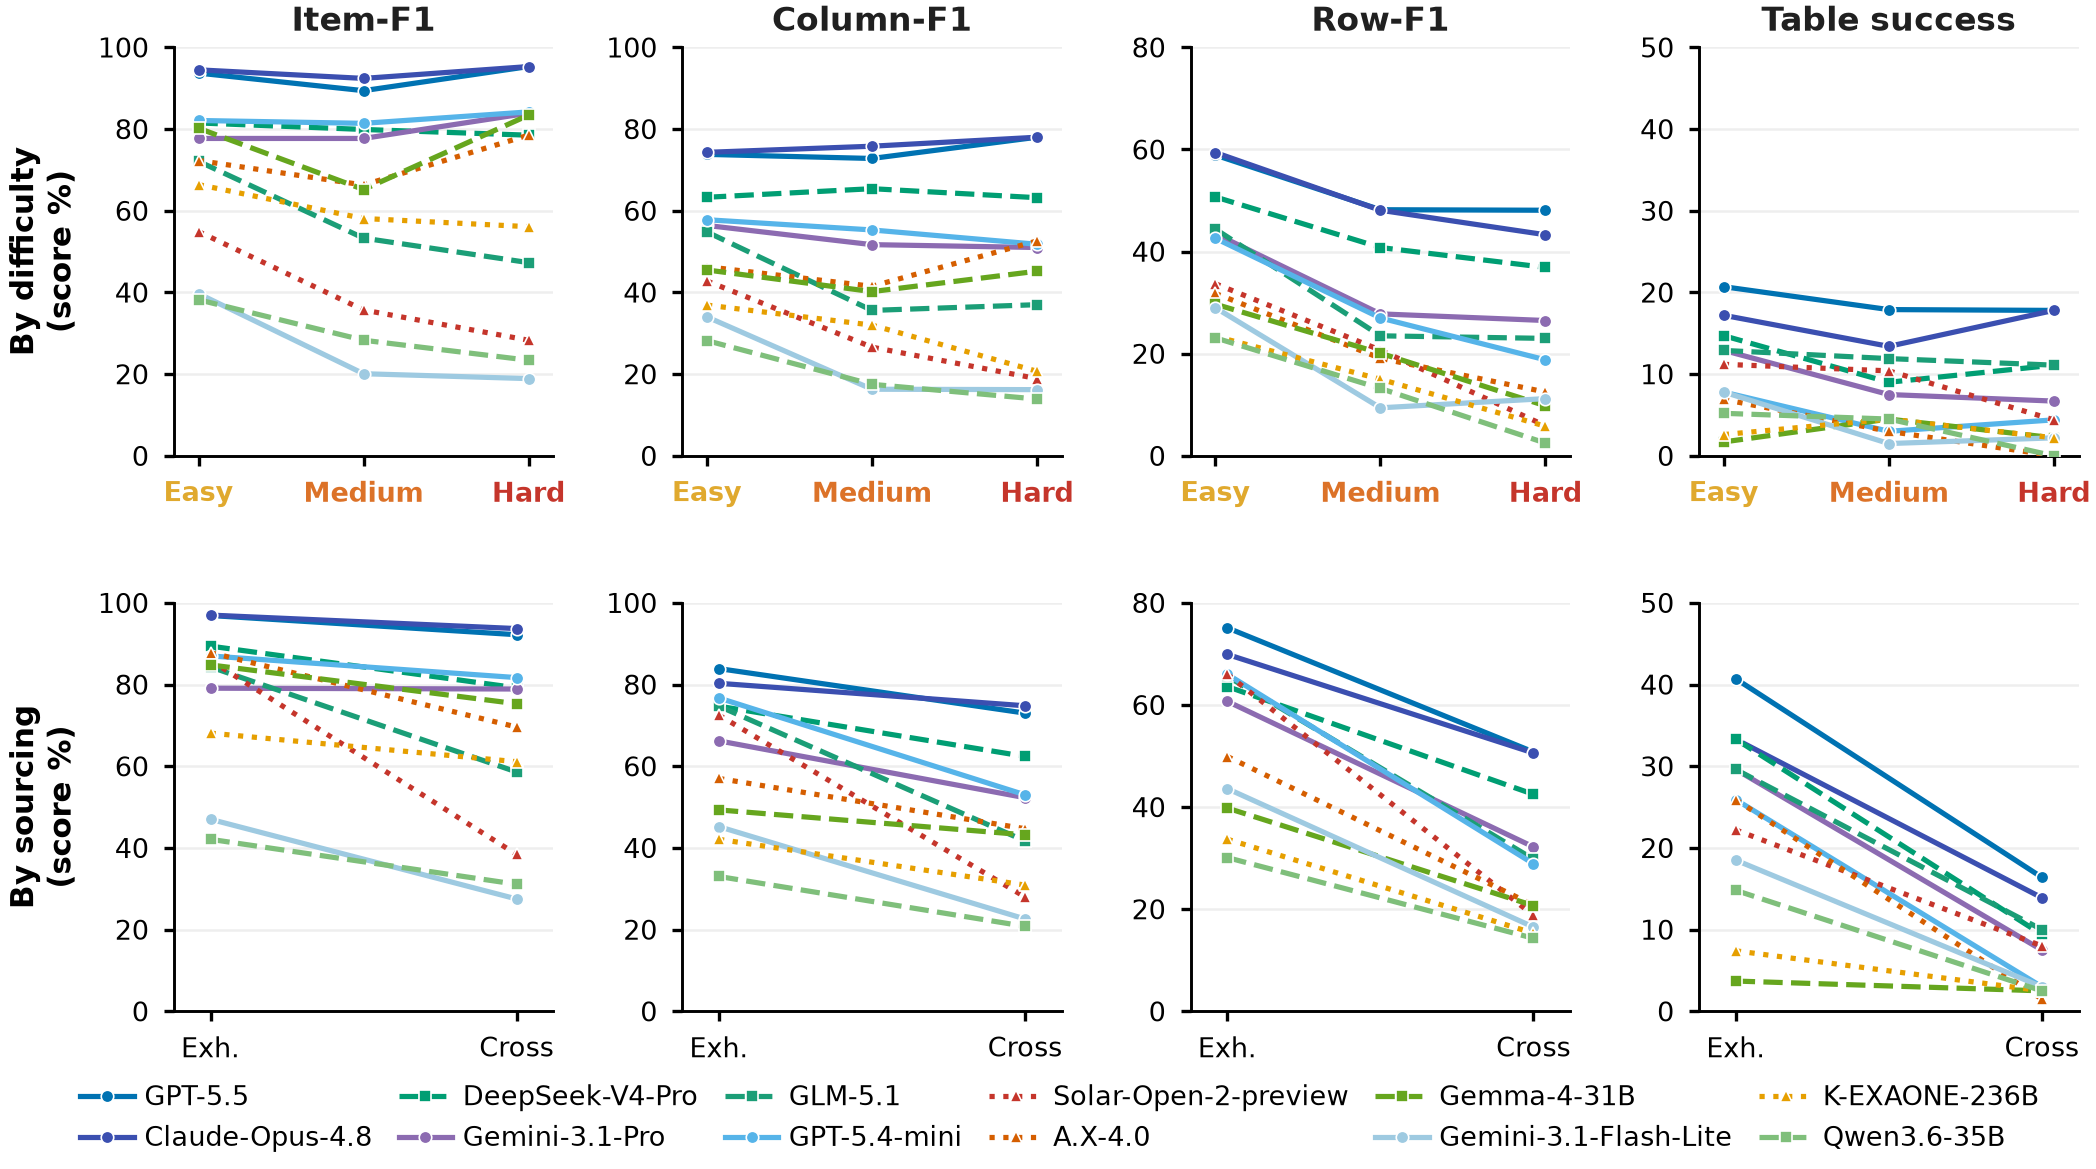
Every model recovers membership far better than complete rows. Item-F1 is 92.8 while the best Row-F1 is only 53.7 — the loss is at the cell level, not in finding who belongs.
Harder knobs, lower scores
Row-F1 falls monotonically Easy → Medium → Hard (0.44 → 0.30 → 0.23). Adding columns and a 2-D composite key reliably degrades accuracy.
More search ≠ better
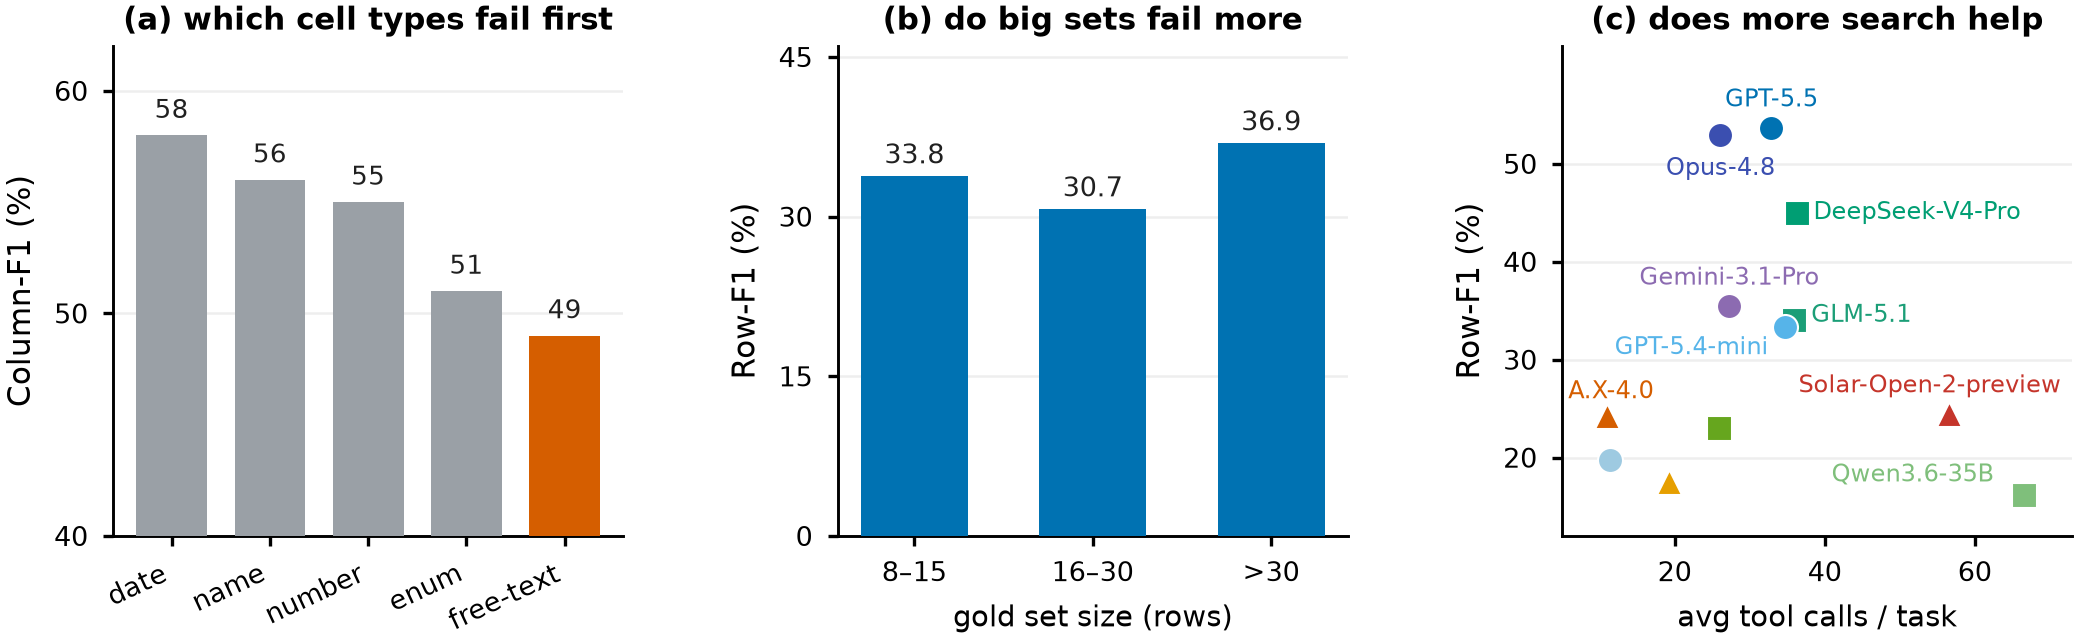
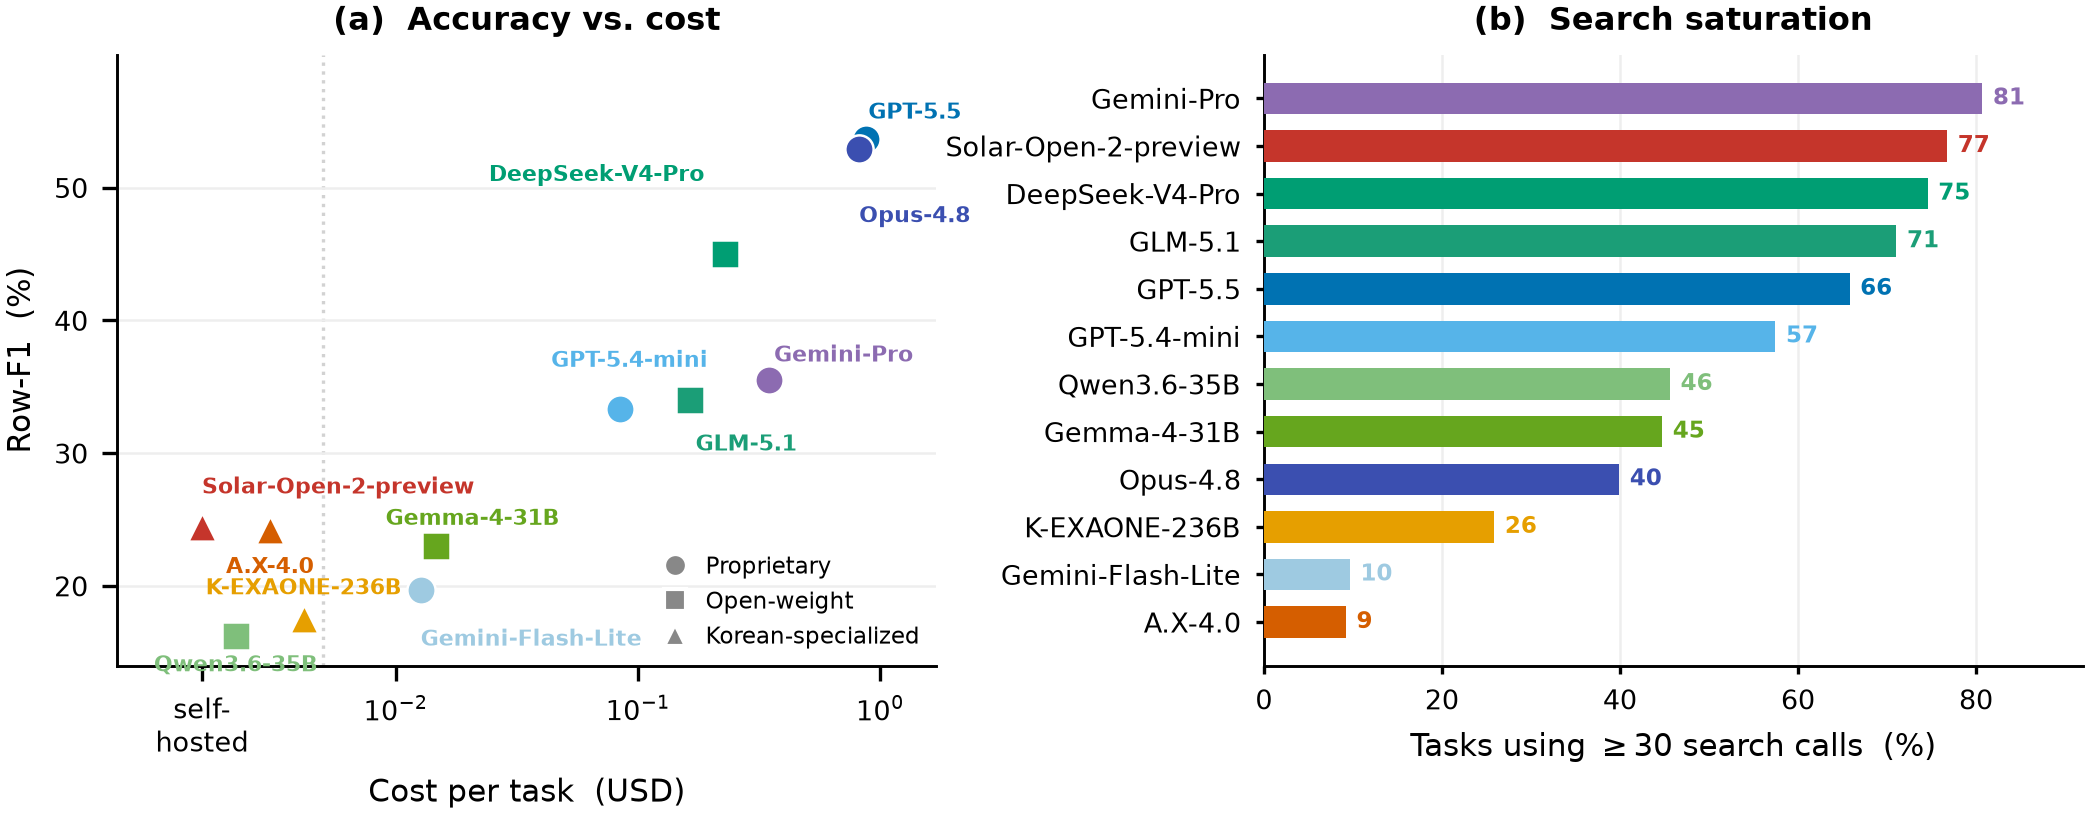
The two heaviest searchers (Qwen3.6 at 66.5 calls/task, Solar at 56.6) score lowest. GPT-5.5 and Opus-4.8 reach the top with moderate search. Effort doesn't buy completeness.
Spend ≠ completeness
Frontier costs ~10× the best open model for +9 Row-F1. DeepSeek-V4-Pro is the value winner — Row 45.0 at $0.23/task — mid-pack among the proprietary field (behind the Claude-Opus line and both Gemini-3.1, ahead of GPT-5.4 and the smaller tiers).
Korean specialists don't close it
A.X-4.0 (24.2), Solar-Open-2 (24.4) and K-EXAONE-236B (17.5) all land at or below the open-weight floor — far from frontier. Korean specialization alone is not the answer.
Finding > formatting
Per cell-type: free-text (49) and enum (51) fail most; dates (58) and names (56) come out right. The hard part is finding and normalizing the value, not formatting the table.
Leaderboard
The Item-vs-Row gap is universal
| Model | Item-F1 | Col-F1 | Row-F1 | Tab.Succ | Parse |
|---|---|---|---|---|---|
| GPT-5.5 PROP | 92.8 | 74.3 | 53.7 | 19.3 | 98.2 |
| Claude-Opus-4.8 PROP | 94.1 | 75.5 | 52.9 | 16.2 | 99.6 |
| Claude-Opus-4.7 PROP | 94.6 | 75.6 | 51.6 | 15.8 | 100.0 |
| Claude-Opus-4.6 PROP | 92.0 | 72.7 | 48.9 | 14.9 | 100.0 |
| Gemini-3.1-Pro PROP | 88.2 | 65.6 | 45.9 | 14.5 | 93.0 |
| Gemini-3.1-Flash-Lite PROP | 89.0 | 69.7 | 45.9 | 7.0 | 99.1 |
| DeepSeek-V4-Pro OPEN | 80.4 | 63.9 | 45.0 | 12.3 | 87.3 |
| Gemini-3.5-Flash PROP | 79.9 | 63.3 | 44.1 | 12.7 | 86.8 |
| Claude-Sonnet-4.6 PROP | 90.2 | 67.7 | 43.6 | 11.8 | 100.0 |
| GPT-5.4 PROP | 89.0 | 61.5 | 41.6 | 10.5 | 100.0 |
| GLM-5.1 OPEN | 61.7 | 45.6 | 34.0 | 12.3 | 66.2 |
| GPT-5.4-mini PROP | 82.3 | 55.9 | 33.3 | 5.7 | 98.2 |
| Claude-Haiku-4.5 PROP | 66.7 | 43.5 | 28.8 | 7.0 | 75.9 |
| Solar-Open-2-preview KR | 44.0 | 33.3 | 24.4 | 9.7 | 62.7 |
| A.X-4.0 KR | 71.7 | 46.2 | 24.2 | 4.4 | 93.4 |
| Gemma-4-31B OPEN | 76.4 | 43.9 | 23.0 | 2.6 | 93.4 |
| DeepSeek-Chat OPEN | 65.4 | 39.4 | 21.3 | 4.0 | 87.3 |
| K-EXAONE-236B KR | 61.9 | 32.3 | 17.5 | 3.1 | 82.9 |
| Qwen3.6-35B OPEN | 32.4 | 22.2 | 16.2 | 4.0 | 38.6 |
| GPT-5.4-nano PROP | 66.6 | 26.6 | 15.9 | 5.7 | 93.4 |
Full pool, n = 228, pass@1. Bold = best per column. Parse = fraction of runs that emit a scorable table (low parse rates reflect models that search heavily then return prose instead of a table).
Why it's hard — the diagnostics
Knobs degrade accuracy; effort doesn't recover it
We probe the Item-vs-Row gap from four angles — which cell types fail, whether big sets are harder, whether more search helps, and what the surviving errors actually are. Every chart points the same way: the bottleneck is finding and normalizing each value, not finding the set or formatting the table.
A failure, cell by cell
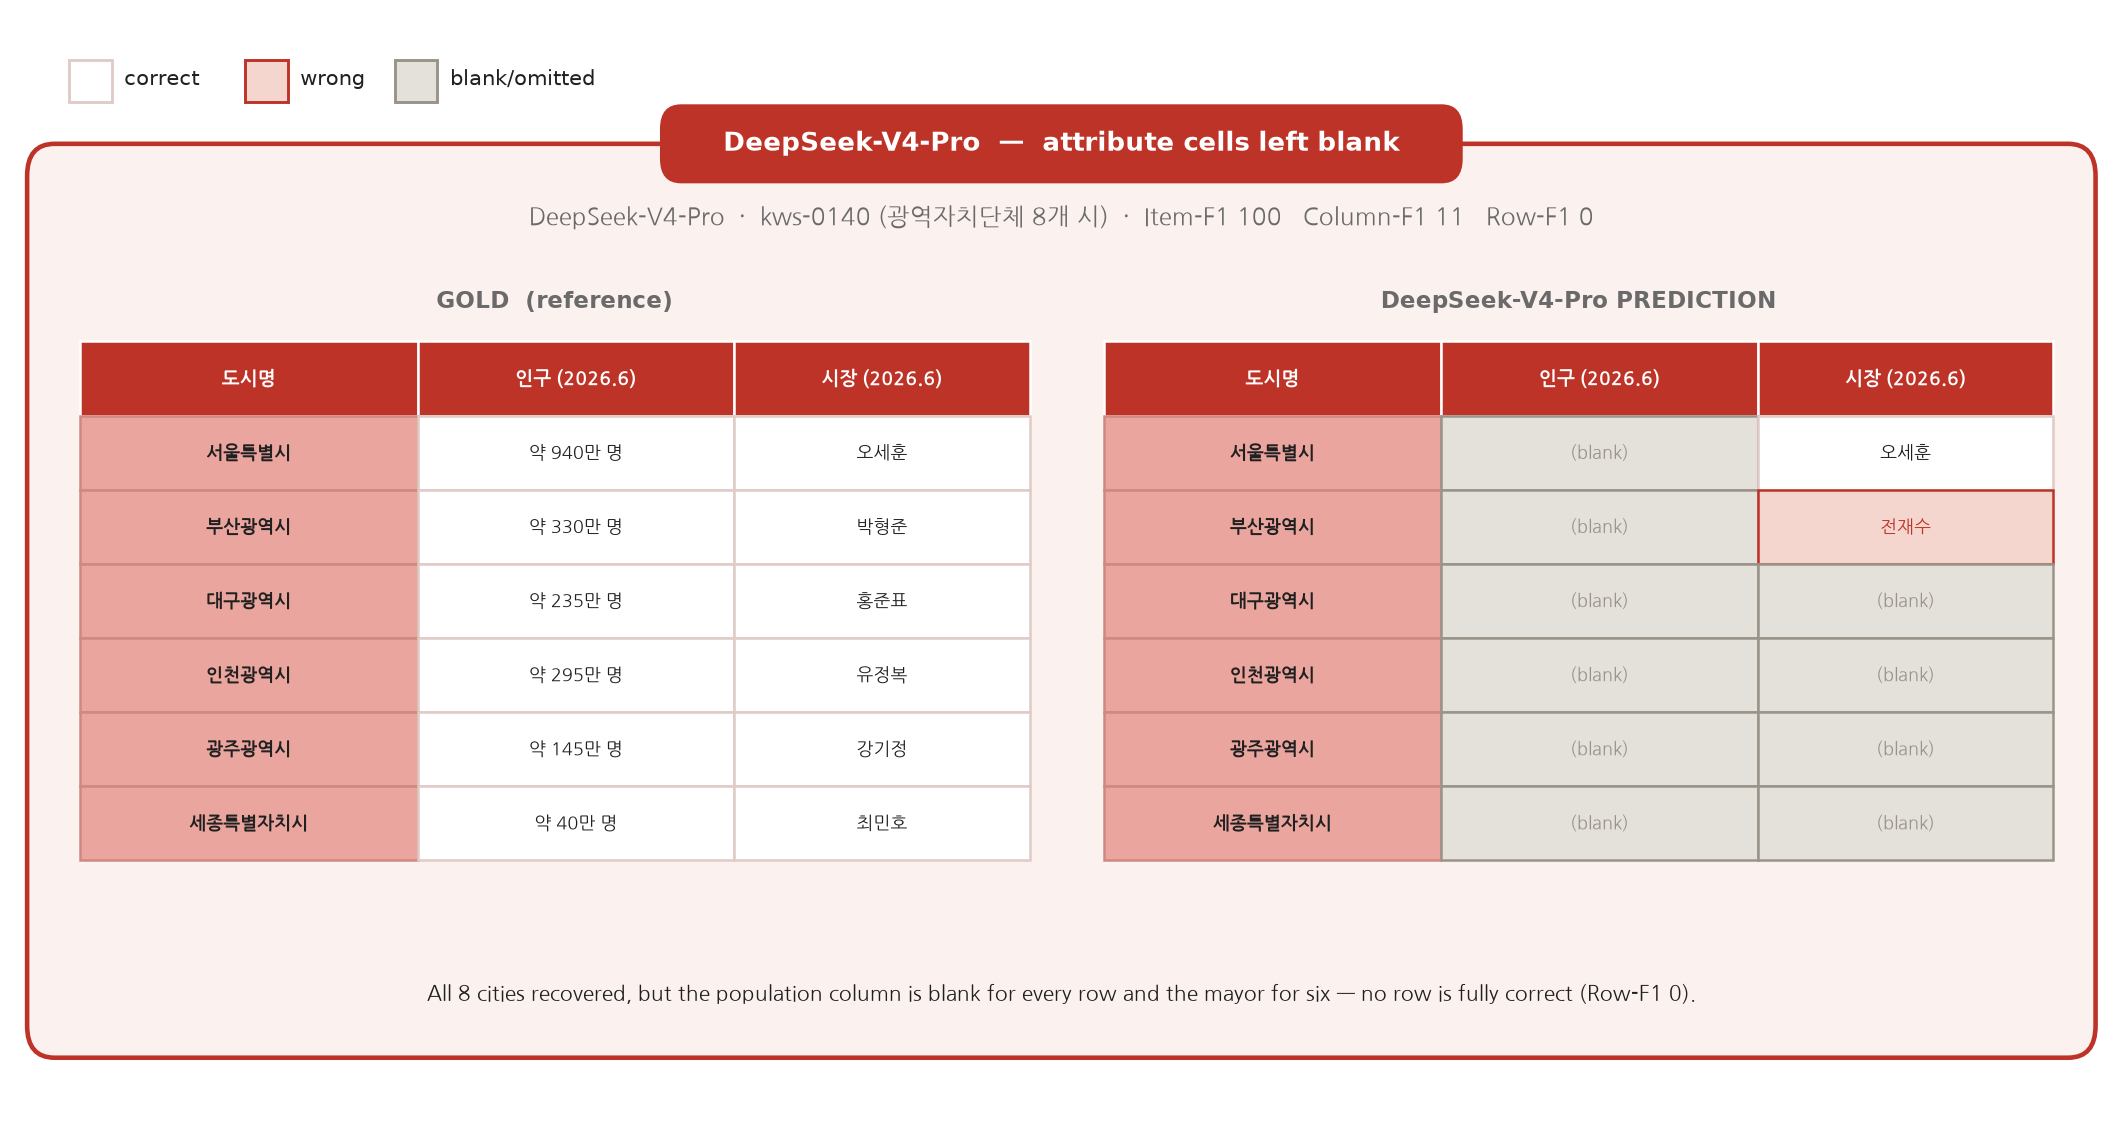
The set is right; the rows are empty
The headline gap is easiest to see in a single table. Below, DeepSeek-V4-Pro is asked for Korea's eight metropolitan cities with each city's population and mayor. It recovers all eight cities (Item-F1 100) — but leaves the population column blank for every row and gets the mayor wrong or missing for six, so not one row is fully correct (Row-F1 0). High Item-F1 and zero Row-F1 in the same task is the pattern, not the exception.
Does strict scoring under-state the gap?
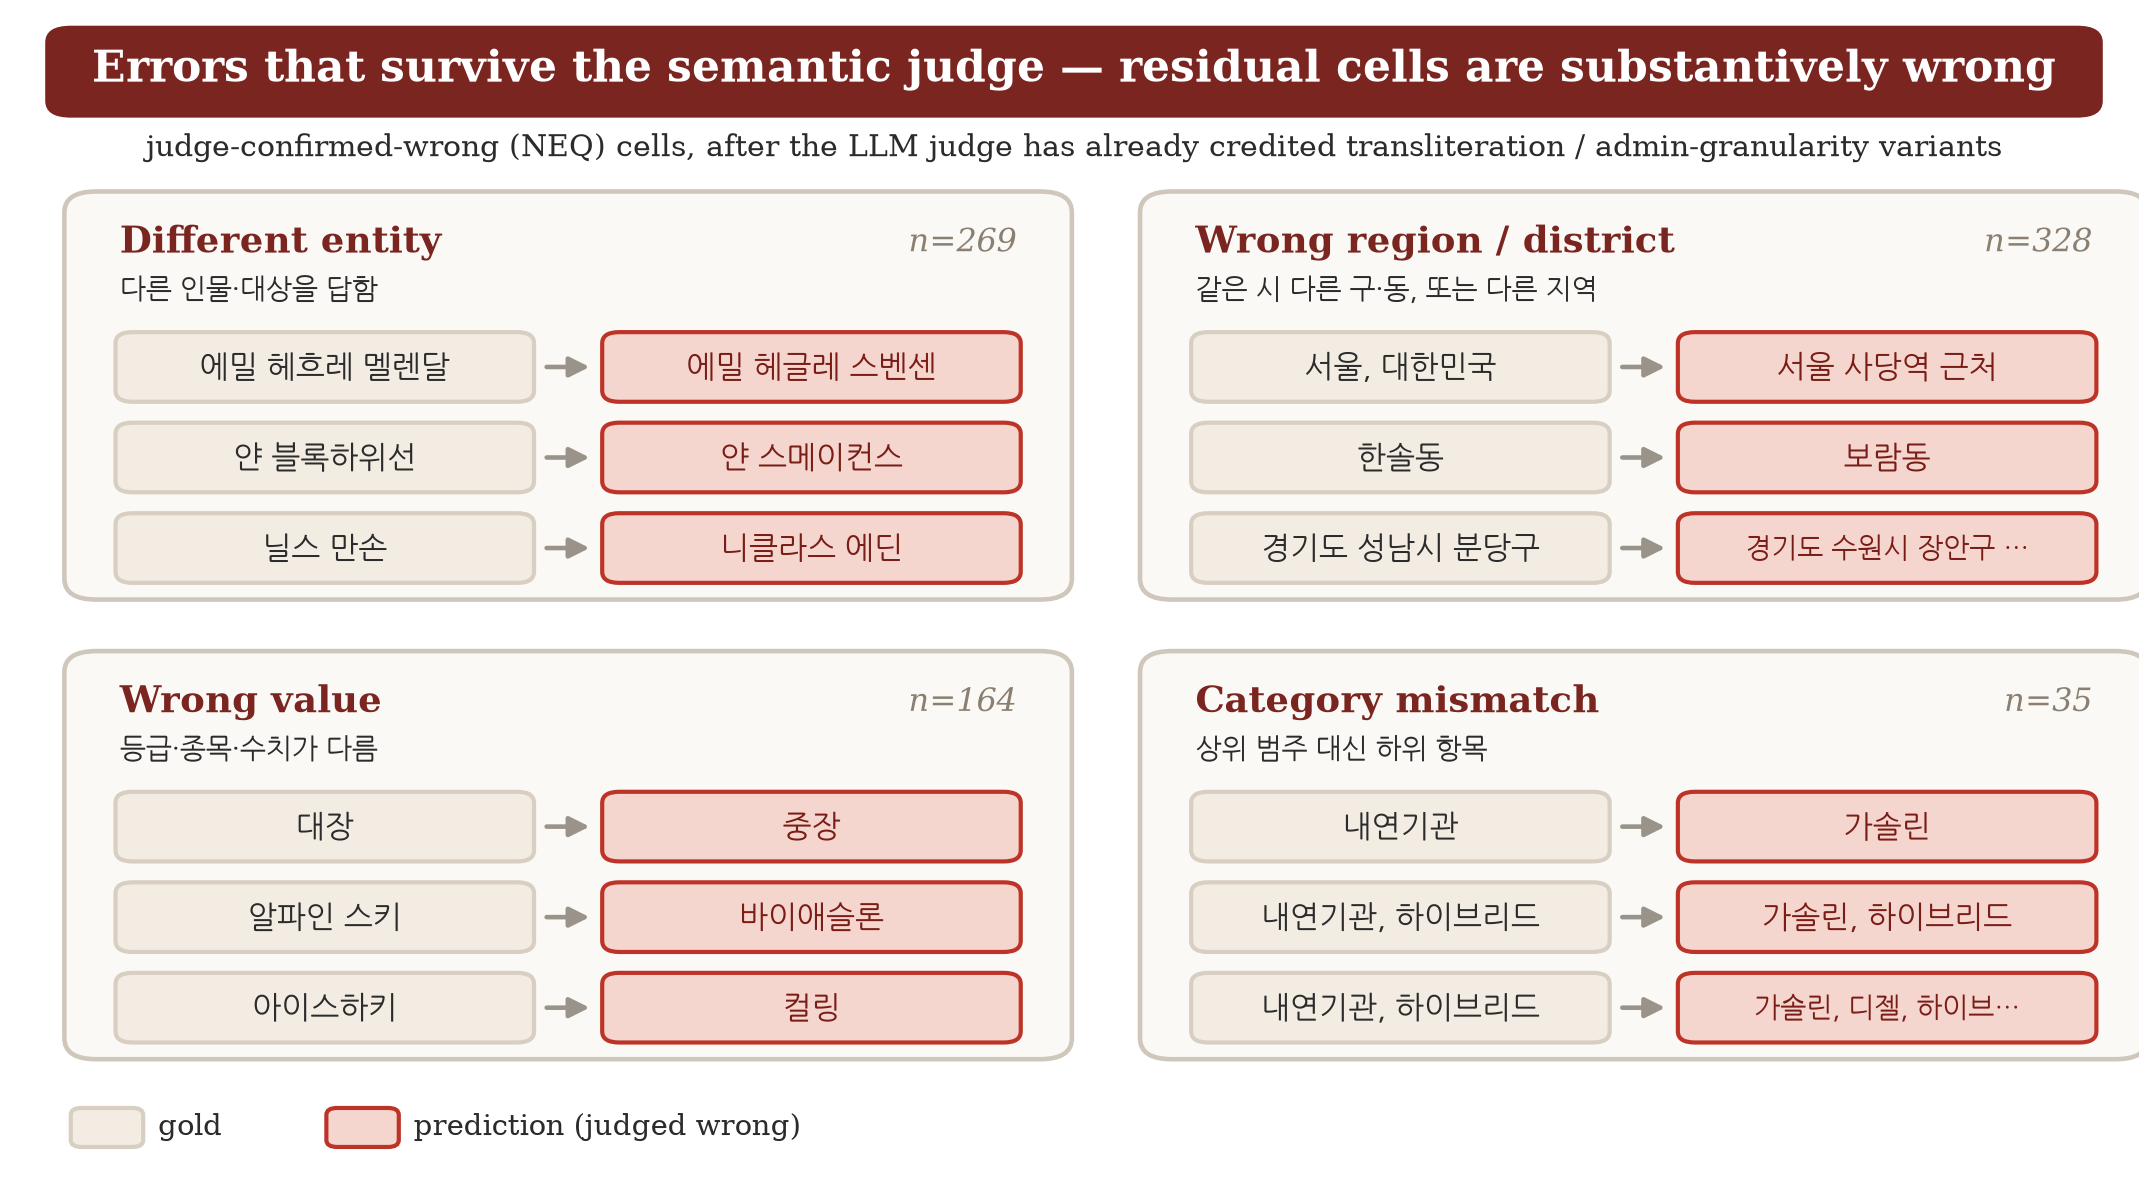
Our deterministic scorer is deliberately conservative, so we test it with a semantic second pass: for every cell it marks wrong on a soft-typed column (name, location, free text), an LLM judge (GPT-5.4-mini) decides whether the prediction still denotes the same answer — crediting transliteration variants and administrative granularity (Gangwon Chuncheon ≡ Chuncheon, Korea), but not a different entity, value, or fabricated specificity. What looks like GPT-5.5 cell mis-fill — the has-children enum written as a free-text count (있음 ≡ 자녀 3명), a residence coarsened (서울, 대한민국 ≡ 서울) — is mostly this kind of surface variant, not a wrong value.
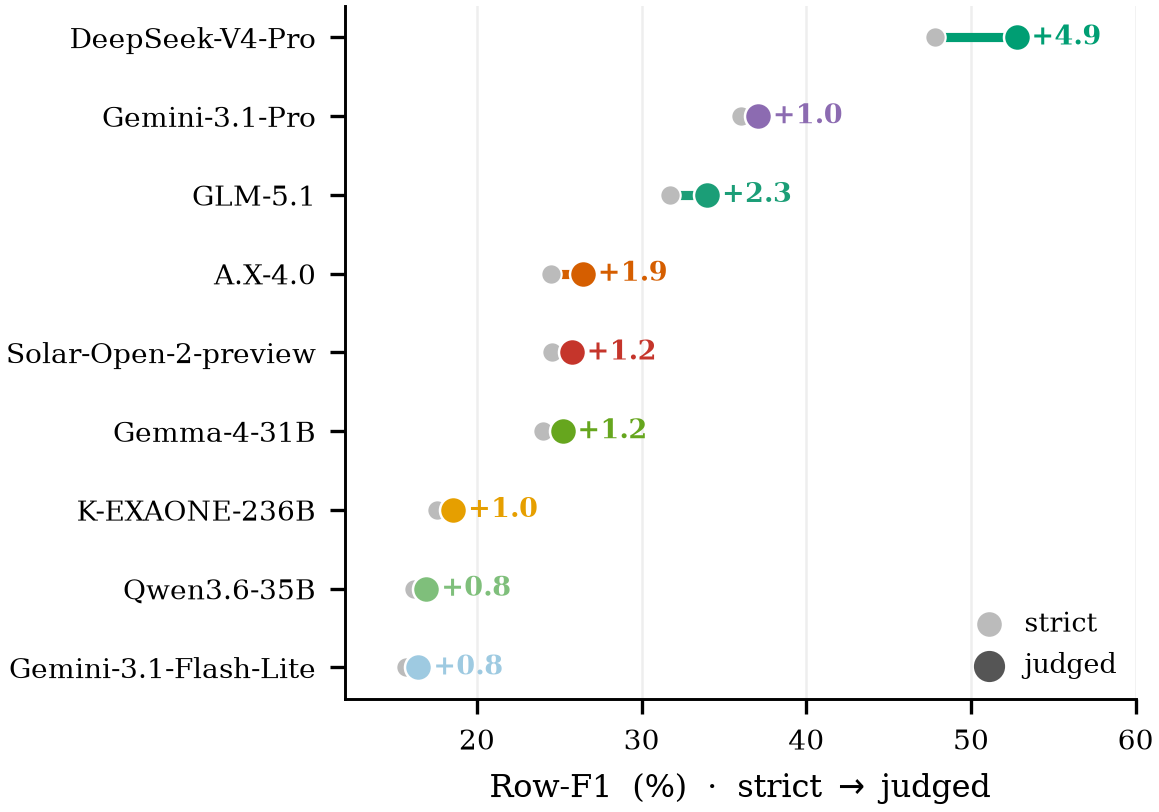
Re-scoring this way lifts Row-F1 by only 0.8–4.9 points, and it lifts the stronger models more: among a model's judge-confirmed-wrong cells, the share the judge rescues rises with strength (GPT-5.5 35% vs K-EXAONE 9%). A strong model's residual errors are surface variants; a weak model's are substantive — a different entity, region, value, or category, as the residual taxonomy above shows. We keep the deterministic scorer as the reproducible default and report the judged numbers as a measurement-validity check, not a new ranking.
Construction & release
Built by synthesize-and-verify, released leakage-aware
One comparator, two jobs
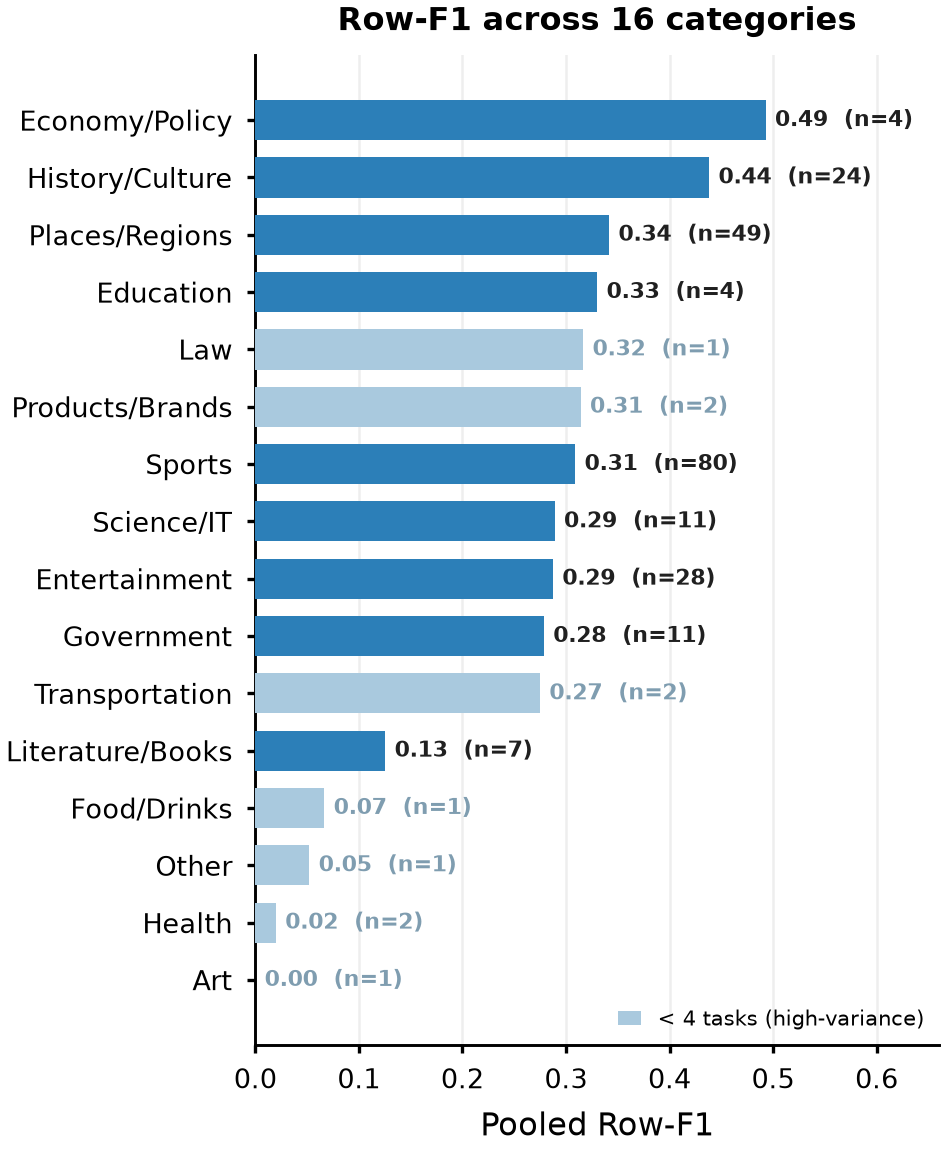
A single normalization-aware comparator is shared between gold construction and grading — so stable date and count columns are not over-dropped on formatting alone (date-granularity, thousands-comma/unit numbers, name variants). The 228 tables span 16 categories and 190 distinct set-parent entities, screened against 5,744 questions from 8 benchmarks with 0 overlap.
Leakage-aware release
The pipeline and scorer are released open (MIT). The gold tables are shared on request rather than posted on the open web — a live-web agent can otherwise search up a publicly posted gold table and copy the answer. This follows GAIA (private test behind a leaderboard) and BrowseComp (canary string).
Citation
BibTeX
@inproceedings{jeong2026kowidesearch,
  title     = {Ko-WideSearch: A Korean Breadth-Search Benchmark
               for Exhaustive Set Enumeration by Web Agents},
  author    = {Jeong, Minbyul},
  year      = {2026},
  note      = {Upstage AI},
  url       = {https://github.com/minstar/Ko-widesearch}
}